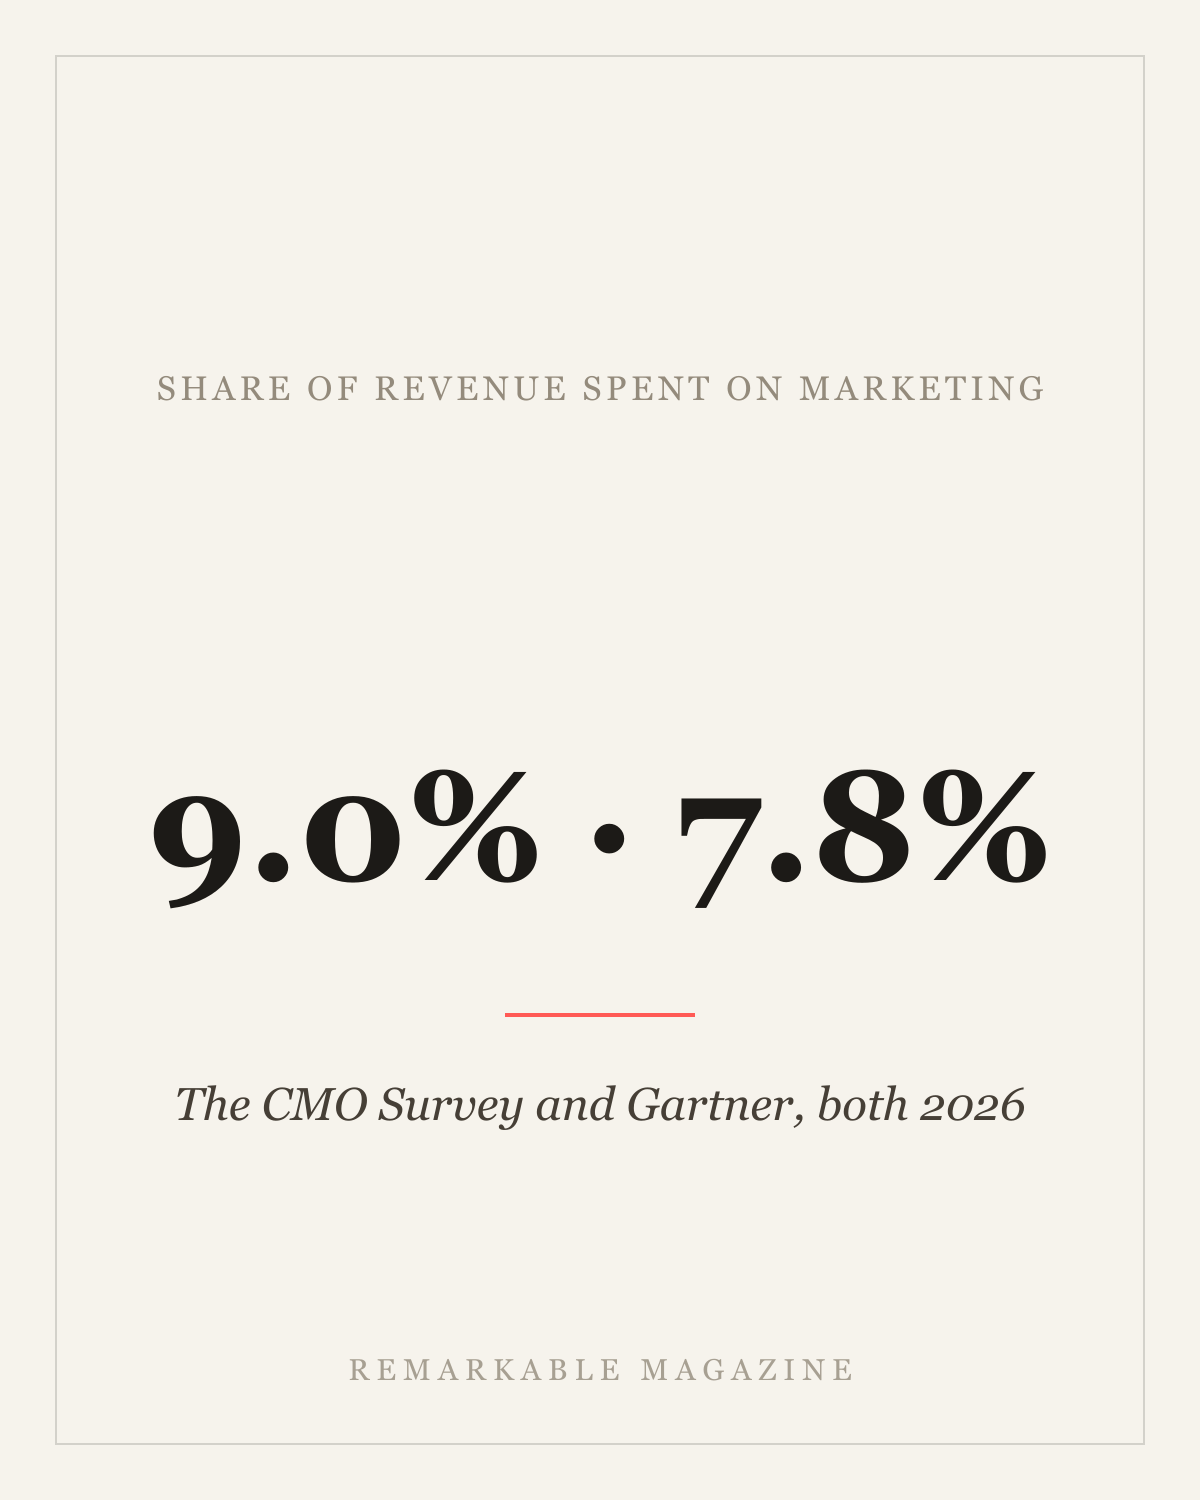
Ask ten agencies what share of revenue should go to marketing and you will get ten confident answers, most of them unsourced. The honest starting point is that two serious research programs have been measuring exactly this for years, they published in 2026, and they do not agree.
That disagreement is the useful part.
The two numbers
The CMO Survey is run by Christine Moorman, a professor at Duke University’s Fuqua School of Business, and co-sponsored by Fuqua, Deloitte and the American Marketing Association. Its 35th edition was fielded between January 7 and 29, 2026, with 308 marketing leaders at US for-profit companies, 97% of them at VP level or above. It put marketing spending at 9.0% of company revenues and 9.6% of overall company budgets.
Gartner’s 2026 CMO Spend Survey polled 401 CMOs and senior marketing leaders across North America, the UK and Europe between January and March 2026. The great majority worked at companies with more than $1 billion in annual revenue. It put marketing budgets at 7.8% of company revenue, up from 7.7% in 2025.
Both are large, repeated, methodologically transparent surveys. Neither is wrong. They are measuring different companies.
Why the gap exists, and what it tells you
The single most important line in this whole piece is the sampling note: Gartner is surveying billion-dollar enterprises, and The CMO Survey includes a wide range of US firms including much smaller ones.
Smaller companies spend a larger share of revenue on marketing. That is not a quirk of the data; it is the mechanics of scale. A $2 billion company has brand equity, an installed base, distribution, and a sales force doing work that a $5 million company has to buy with media. The same absolute dollars buy proportionally more awareness when a brand is already known.
Which means the practical takeaway is not “the answer is 9.0%” or “the answer is 7.8%.” It is:
The larger you get, the smaller marketing should be as a percentage of revenue — and if yours is heading the other way as you scale, that is a signal worth chasing down.
The number nobody has for you
Here is the limit of both datasets, stated plainly: neither survey covers early-stage or small businesses. Gartner’s respondents are enterprises. The CMO Survey’s respondents are companies large enough to employ a VP-level marketing leader who answers academic surveys.
There is a widely repeated claim online that the US Small Business Administration recommends 7 to 8 percent of revenue for businesses under $5 million. It appears on dozens of agency blogs. No primary SBA source for it could be located while researching this piece, so it is not cited here as a benchmark. If you have seen that number quoted at you, ask where it came from.
If you are pre-revenue or early, percentage-of-revenue benchmarking is the wrong instrument entirely. A percentage of a small number is a small number, and it will not buy you a market. Budget from customer acquisition economics instead — what it costs you to acquire a customer, what that customer is worth, and how long you can fund the gap.
Marketers plan for more than they get
One of the more quietly useful patterns in The CMO Survey is the space between what marketing leaders forecast and what actually happens.
In the Fall 2024 edition — the 33rd, fielded September 4 to 25, 2024 with 260 marketing leaders — respondents projected 8.6% growth in overall marketing spending over the coming year. Actual year-over-year growth reported in the same survey was 5.8%. Digital marketing was projected to grow 12.7%; traditional advertising posted 0.8% growth, its first positive reading in two years.
By January 2026, actual growth had fallen to 1.7% — the weakest in several years.
If you build a plan on the forecast number rather than the realized one, you are budgeting for a year that historically does not arrive. Moorman’s own read on the January 2026 mood was blunt: “Faced with uncertainty, marketers are pulling back toward what they know.”
Where the 2026 money is actually going
The composition of the budget moved far more than its size, and the movement is almost entirely AI.
Gartner found CMOs directing an average of 15.3% of marketing budgets to AI initiatives. It also found that only 30% report the mature AI readiness needed to scale those capabilities — and that 70% named AI a key 2026 priority while 56% said they lacked sufficient budget to execute their 2026 strategy at all.
The split inside that data is the part worth acting on. CMOs whose organizations reported mature or fully developed AI readiness allocated 21.3% of marketing budget to AI, and reported total marketing budgets of 8.9% of company revenue — meaningfully above the 7.8% average. The organizations that are better at using the technology are also spending more overall, not less.
Moorman’s framing of the same problem from the academic side: “Companies will need to ensure that their investments in technology are matched with investments in the capabilities needed to use it effectively.”
Translated for a founder with a real budget: buying the tool is the cheap half.
How to actually set the number
Nothing below is a benchmark. It is the sequence the benchmarks imply.
- Establish your own baseline before borrowing anyone else’s. Marketing spend as a share of your revenue, tracked quarterly, is worth more than any industry average, because it is measured on your business.
- Compare yourself to companies your size, not to the survey headline. If you are under $50 million in revenue, Gartner’s 7.8% describes a completely different animal.
- Budget from unit economics when you are small. Acquisition cost, customer value, payback period. Percentage-of-revenue is a governance tool for companies that already have revenue to govern.
- Plan against realized growth, not forecast growth. The gap between the two has been consistent and in one direction.
- Fund the capability alongside the software. The 2026 data says the firms getting returns on AI spend are the ones that also invested in being able to use it.
- Refuse unsourced benchmarks — including the ones that flatter you. If a number cannot be traced to a named study with a sample size and a fielding date, it is not a benchmark. It is a sales aid.
Related reading
- How Much Should Founders Pay Themselves? — the other percentage-of-revenue question founders ask, answered the same way.
- How to Split Equity Between Co-Founders — a second case where two credible authorities publicly disagree, and the disagreement is the lesson.
- Directing AI Without Losing the Brand — what the AI line item in that budget looks like when someone is actually running it.
The CMO Survey figures — 35th edition, fielded January 7–29, 2026, 308 US for-profit marketing leaders, 97% at VP level or above, marketing spending at 9.0% of company revenues and 9.6% of company budgets, 1.7% spending growth, and both Christine Moorman quotes — are per Duke University’s Fuqua School of Business (published March 31, 2026). The Fall 2024 figures (33rd edition, fielded September 4–25, 2024, 260 marketing leaders, 8.6% projected versus 5.8% actual spending growth, 12.7% projected digital growth, 0.8% traditional advertising growth) are per The CMO Survey’s own published results. The Gartner 2026 CMO Spend Survey figures — 401 marketing leaders in North America, the UK and Europe, fielded January–March 2026, majority above $1 billion in revenue, 7.8% of company revenue in 2026 against 7.7% in 2025, 15.3% average AI allocation, 30% reporting mature AI readiness, 21.3% AI allocation and 8.9% of revenue among AI-mature organizations, 70% naming AI a key priority and 56% reporting insufficient budget — are per Marketing Dive’s report of the survey (Sara Karlovitch, May 11, 2026) and Gartner’s press release of the same date. The claim that the US Small Business Administration recommends 7–8% of revenue for businesses under $5 million appears widely online; no primary SBA source for it was found, and it is therefore not presented here as a benchmark.
Frequently asked
What percentage of revenue should a company spend on marketing?
The two most credible 2026 benchmarks disagree, and the disagreement is informative. The CMO Survey (35th edition, fielded January 7-29, 2026, 308 US marketing leaders) found marketing spending at 9.0% of company revenues. Gartner's 2026 CMO Spend Survey (401 marketing leaders in North America, the UK and Europe, fielded January to March 2026) found 7.8%, up marginally from 7.7% in 2025. The gap is largely a sampling difference: most of Gartner's respondents work at companies with over $1 billion in revenue, and large firms spend a smaller share of revenue on marketing than smaller ones do.
Are marketing budgets growing in 2026?
Barely. The CMO Survey found marketing spending growing 1.7% over the prior year, the weakest reading in several years, and its director, Duke professor Christine Moorman, characterized the mood as defensive: 'Faced with uncertainty, marketers are pulling back toward what they know.' Gartner's figure moved one tenth of a percentage point, from 7.7% of company revenue in 2025 to 7.8% in 2026.
How much of a marketing budget is going to AI?
Gartner's 2026 CMO Spend Survey found CMOs allocating an average of 15.3% of their marketing budgets to AI initiatives, but only 30% reporting the mature AI readiness needed to scale those capabilities. Organizations that did report mature or fully developed AI readiness allocated 21.3% of marketing budget to AI and reported total marketing budgets of 8.9% of company revenue — above the 7.8% survey average.